How to Read a VPD Chart
A VPD chart combines temperature, humidity, and leaf temp to show if your plant’s environment is optimal or causing stress—no calculations needed. By finding your position on the chart and reading the color zone, you instantly know whether to adjust conditions. It turns guesswork into precise control, helping you fix issues early and maintain ideal growth at every stage.
Table of Contents
What Is a VPD Chart?
A VPD chart is a simple tool that tells you whether your growing environment is comfortable for your plants.
Think of it like a weather comfort chart — but for plants instead of people. Just like humans feel uncomfortable when it’s too hot and humid, plants also struggle when the air around them is wrong.
Here’s what the chart does: it combines two things — temperature and humidity — and shows you how much stress your plant is under because of the air around it.
When the air is too dry, the plant loses water faster than its roots can replace it. The plant gets stressed and closes its pores to protect itself — which also slows down growth.
When the air is too wet, the plant can’t release moisture properly. This slows nutrient movement inside the plant and can lead to mold and disease.
The VPD chart shows you a safe middle zone — where the air pulls just enough moisture from the plant to keep it growing strong without causing stress.
You don’t need to do any math. You just look at the chart, find your temperature and humidity, and the chart tells you where you stand.
If you want to know more about VPD, then check out our guide on Vapour Pressure Deficit (VPD).
Why Growers Use a VPD Chart
Growing healthy plants isn’t just about watering and light. The air around your plant matters just as much — and getting it wrong costs you yield, time, and money.
But here’s the problem: most growers guess. They set a temperature, pick a humidity number they read somewhere, and hope for the best. That guesswork leads to slow growth, nutrient problems, and unhealthy plants.
A VPD chart removes the guesswork completely.
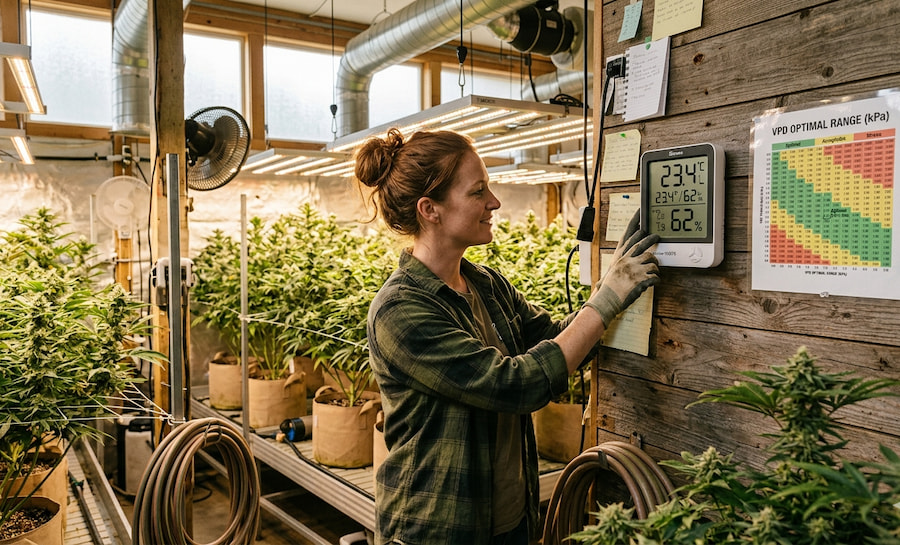
Instead of doing complicated math or reading long articles, you simply look at your temperature, look at your humidity, and the chart instantly shows you if your plant is comfortable or stressed.
It works like a GPS for your growing environment. You don’t need to understand every road — you just follow the directions.
Here’s why growers trust it:
- Saves time — No calculations needed. The answer is already on the chart.
- Works at any stage — Seedlings, vegetative growth, and flowering all need different VPD ranges. The chart covers them all.
- Prevents costly mistakes — Catching a bad environment early stops mold, wilting, and slow growth before they damage your crop.
Works for all crops — Tomatoes, cannabis, lettuce, peppers, herbs — every plant breathes air. VPD applies to all of them.
If you're curious about the math behind the chart, read our guide on How to Calculate VPD — but know that you never have to calculate it manually. The chart does it for you.
Parts of a VPD Chart (Simple Breakdown)
Before you can read a VPD chart, you need to know what you’re looking at. A VPD chart has three main parts. Once you understand each one, the whole chart becomes easy to use.
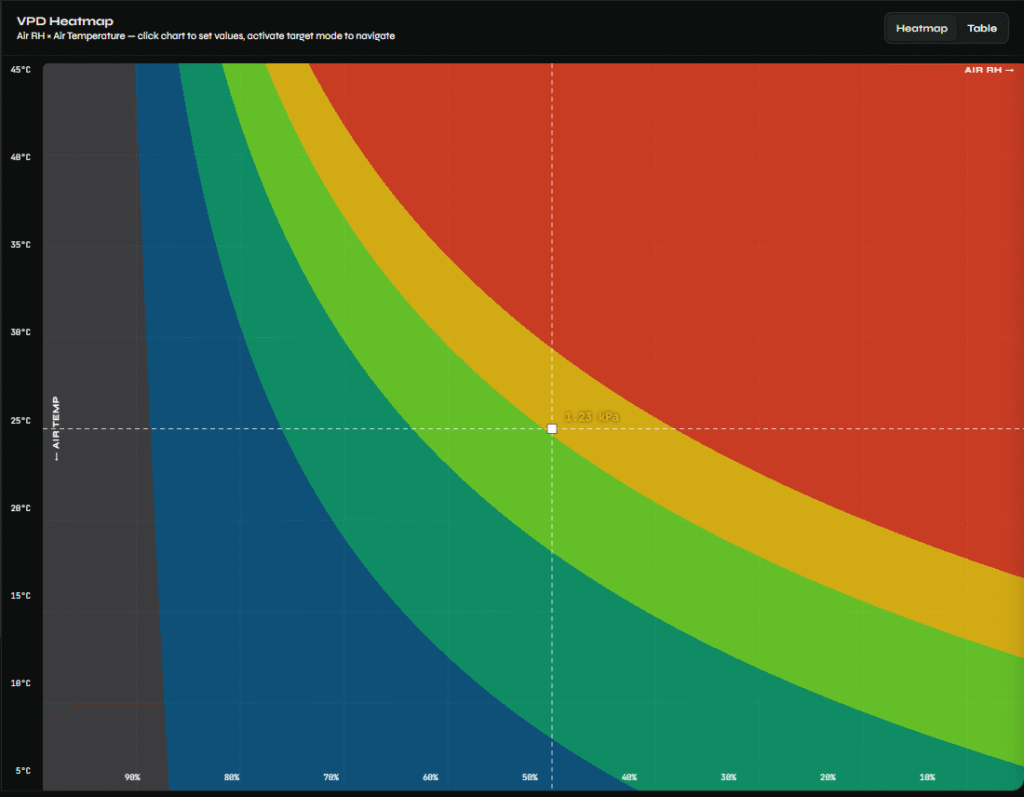
1. The Temperature Axis (Side or Bottom of the Chart)
This is a row or column of numbers showing temperature — usually in both °F and °C.
Think of it as the “how warm is my room?” line. You find your room temperature here first. This is always your starting point.
2. The Humidity Axis (The Other Side)
This shows Relative Humidity (RH) — the percentage of moisture in your air.
Think of it as the “how wet is my air?” line. Your hygrometer gives you this number. Once you have it, you find it on this axis.
Together, temperature + humidity create a meeting point on the chart — like finding a square on a map using two coordinates.
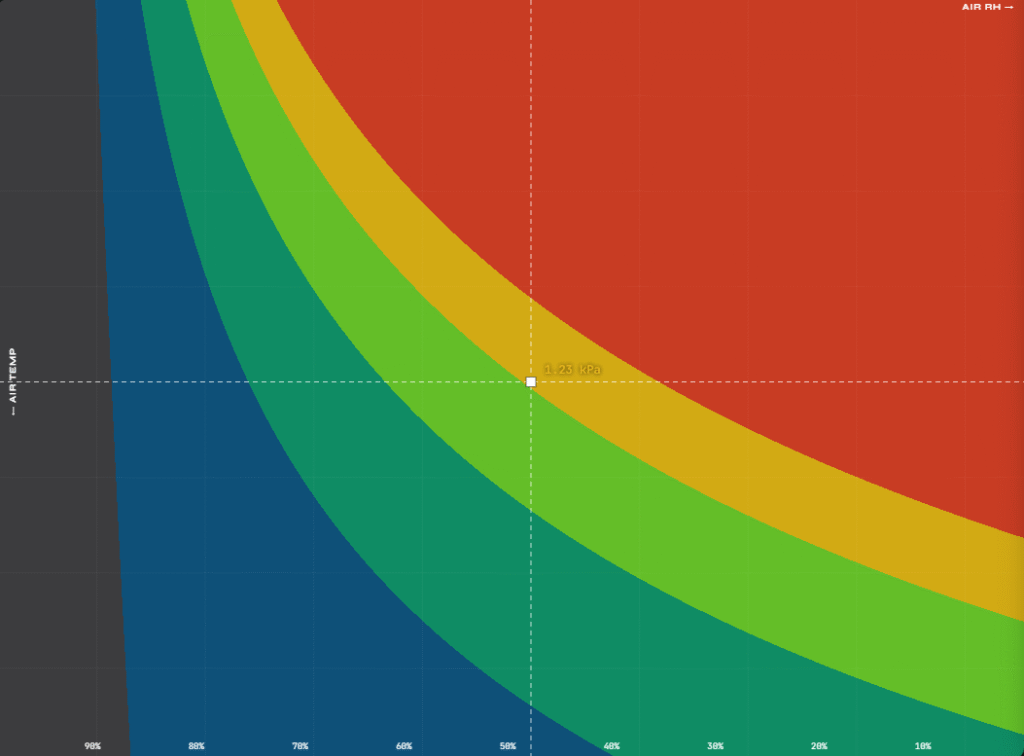
3. The Color Zones (The Heart of the Chart)
Where your temperature and humidity lines meet, you’ll land in a colored zone. Each color tells you something different:
- 🔵 Blue zone — Air is too humid. Plant can’t release moisture properly.
- 🟢 Green zone — Perfect. Plant is comfortable and growing well.
- 🟡 Yellow zone — Getting dry. Watch your humidity closely.
- 🔴 Red zone — Too dry. Plant is losing water too fast and getting stressed.
You don’t need to memorize numbers. The color does the thinking for you.
4. The VPD Numbers Inside the Chart
Inside each colored zone, you’ll also see small numbers — these are the actual VPD values measured in kPa (kilopascals).
You don’t need to understand kPa deeply. Just know this:
- Lower numbers = more humid air = plant holds moisture
- Higher numbers = drier air = plant loses moisture faster
The color zones already translate these numbers into simple actions for you.
Step-by-Step: How to Read a VPD Chart
Reading a VPD chart takes less than 60 seconds once you know the steps. Here’s exactly how to do it — using our tool as your guide.
Step 1: Set Your Crop and Growth Stage
At the top of the tool, select your crop — for example, Cannabis — and choose your growth stage (Seedling, Veg, Flower, etc.).
This matters because a seedling needs different air conditions than a flowering plant. The tool adjusts the ideal VPD zones for you automatically.
Step 2: Enter Your Air Temperature
Look at your thermometer and find your room’s air temperature.
In the left panel, slide the Air Temperature slider to match your reading. In the example shown, the temperature is set to 25°C.
This sets your horizontal line on the heatmap — the chart now knows “how warm” your space is.
Step 3: Enter Your Air Humidity
Check your hygrometer for your Relative Humidity (RH) percentage.
Slide the Air Relative Humidity slider to match. In the example, it’s set to 50% RH.
This sets your vertical line. Now both lines are on the chart — ready to meet.
Step 4: Add Your Leaf Temperature (Optional but Powerful)
This is something most basic charts completely ignore.
Leaf temperature is usually 1–3°C cooler than air temperature. In the example, air is 25°C and leaf temperature is set to 23°C.
Why does this matter? Because VPD is actually calculated from the leaf’s perspective — not just the air. Our tool uses this for a more accurate result. Check your leaf temp with an infrared thermometer if you have one.
Step 5: Find Your Point on the Heatmap
Look at the chart on the right. You’ll see two dashed lines crossing — one from your temperature, one from your humidity.
Where they meet is your current position on the chart. In the example, the lines meet at the small white square — showing 1.23 kPa.
Step 6: Read the Color Zone
Look at the color behind your crossing point:
- The example lands in the yellow-green zone — labeled Mid / Late Flower (1.2–1.6 kPa)
- The top-left panel instantly confirms: 1.23 kPa — MID / LATE FLOWER ✅
That’s your VPD reading. No math. No guessing.
Step 7: Check the Zone Legend and Take Action
On the bottom-left, the tool shows all VPD zones for your crop with color labels:
- 🔵 Under transpiration — too humid
- 🟢 Early Veg / Propagation — slightly humid but safe
- 🟢 Late Veg / Early Flower — ideal for most stages
- 🟡 Mid / Late Flower — ideal for flowering
- 🔴 Over transpiration — too dry
If your point is in the wrong zone, adjust your temperature or humidity until you land in the right color for your plant’s stage.
What the Colors Mean (Good vs Bad Zones)
The color zones are the most important part of the chart. They do all the thinking for you — you just need to know what each color is telling you and what to do about it.
Here’s exactly what each color means, based on our tool:
⬛ Gray — Danger Zone (Leaf Below Dew Point)
This is the worst zone to be in.
When the air is so humid that it’s cooler than your plant’s leaves, water starts to form on the leaf surface — just like a cold glass sweating on a warm day. This creates the perfect conditions for mold, rot, and disease.
What to do: Immediately reduce humidity and improve airflow. Do not leave your plants in this zone.
🔵 Blue — Under Transpiration (VPD below 0.4 kPa)
The air is too wet. Your plant is barely sweating.
Think of it like trying to dry a towel in a steamy bathroom. The air is already so full of moisture it can’t pull any from your plant. This slows down nutrient absorption and makes your plant lazy and weak.
What to do: Raise your temperature slightly or reduce humidity to push into the green zone.
🟢 Teal/Dark Green — Early Veg / Propagation (0.4–0.8 kPa)
This is the safe zone for young plants, clones, and seedlings.
Young plants have small, fragile root systems. They can’t handle too much water loss yet. This zone keeps the air gentle enough for delicate plants to grow without stress.
What to do: Stay here during propagation and early veg. No changes needed if you’re in this range.
🟢 Green — Late Veg / Early Flower (0.8–1.2 kPa)
This is the sweet spot for most of the grow cycle.
Your plant is strong enough to handle a proper flow of water from roots to leaves. Nutrients move efficiently, growth is fast, and the plant is working exactly the way it should.
What to do: Aim to stay in this zone during vegetative growth and early flowering. This is your target.
🟡 Yellow — Mid / Late Flower (1.2–1.6 kPa)
The air is getting drier — and that’s actually right for flowering plants.
During flowering, slightly drier air encourages the plant to work harder, pulling more water and nutrients up through its roots. It also reduces mold risk when buds are dense and heavy.
What to do: This is correct for mid and late flower. Keep monitoring and don’t let it push into red.
🔴 Red — Over Transpiration (above 1.6 kPa)
The air is too dry. Your plant is losing water faster than its roots can supply it.
The plant responds by closing its leaf pores (called stomata) to stop water loss — but this also stops CO₂ from entering, which shuts down growth almost completely. Prolonged time here causes wilting, tip burn, and stress.
What to do: Raise humidity or lower temperature immediately to bring VPD back into the safe zone.
One Simple Rule to Remember:
🟢 Green = Go.
🔵 Blue = Too wet, warm up or dry out.
🔴 Red = Too dry, add humidity or cool down.
⬛ Gray = Act now.
Real Example From a Grow Tent
Let’s walk through a real situation. This is the kind of thing that happens in grow tents every day — and the chart solves it in seconds.
The Situation:
A grower is running a cannabis grow in week 3 of flowering. They check their devices and see:
- 🌡️ Air Temperature: 27°C
- 💧 Air Humidity: 65% RH
- 🍃 Leaf Temperature: 25°C (measured with an infrared thermometer)
They enter these numbers into the tool. Let’s see what happens.
What the Tool Shows:
The two dashed lines cross on the heatmap — and the point lands deep in the blue-teal zone.
The top panel reads: 0.71 kPa — Early Veg / Propagation
But wait — this plant is in week 3 of flower. It should be in the green to yellow zone (0.8–1.6 kPa).
That’s a problem.
What This Means for the Plant:
At 0.71 kPa, the air is too wet for a flowering plant. The plant is barely transpiring — water and nutrients are moving slowly through the plant. In week 3 of flower, when the plant needs maximum nutrient flow to build buds, this is holding it back.
Worse — at 65% humidity with dense flowering buds, this grower is one bad airflow day away from mold and bud rot.
How to Fix It:
The grower has two options:
Option A — Reduce Humidity Drop RH from 65% down to around 50–55%. This pushes the crossing point to the right on the heatmap — moving it from blue into the green/yellow zone, landing around 1.1–1.3 kPa. Perfect for mid-flower.
Option B — Slightly Raise Temperature Raise air temp from 27°C to around 28–29°C while keeping humidity the same. This moves the crossing point downward on the heatmap — also pushing into the green zone.
Best move: Combine both slightly — bring humidity to 55% and temperature to 28°C. The tool will show the result update in real time as you adjust the sliders.
The Result After Adjustment:
- 🌡️ Air Temperature: 28°C
- 💧 Air Humidity: 55% RH
- 📊 New VPD Reading: ~1.25 kPa — Mid / Late Flower ✅
The crossing point now sits comfortably in the yellow-green zone — exactly where a week 3 flowering cannabis plant needs to be. Nutrient flow improves, mold risk drops, and the plant can focus all its energy on building yield.
The Lesson:
One small check. Two slider adjustments. The difference between a struggling plant and a thriving one.
This is why growers use a VPD chart — not to do science, but to make fast, confident decisions that actually improve their grow.
What Most Growers Get wrong When Reading Charts
Most growers don’t fail because they’re doing something completely wrong. They fail because they’re doing something almost right — and that small mistake quietly hurts their plants for weeks without them knowing.
Here are the most common errors — and how to avoid them.
Mistake 1: Only Looking at One Number
This is the most common mistake of all.
A grower checks their humidity — sees 55% — and thinks “that’s good.” But they forget to check temperature at the same time. A 55% RH at 20°C gives a very different VPD than 55% RH at 30°C.
VPD is never just one number. It’s always temperature AND humidity together.
If you’re only checking one, you’re only seeing half the picture.
Mistake 2: Ignoring Leaf Temperature
Most charts — and most growers — only use air temperature. But VPD is actually about what’s happening at the leaf surface, not just the air around it.
Leaf temperature is typically 2–3°C cooler than air temperature. That difference changes your actual VPD reading more than most growers realize.
For example: Air at 26°C and leaf at 23°C produces a noticeably different VPD than if both were at 26°C. Using air temperature alone gives you an estimate — using leaf temperature gives you the truth.
Our tool includes a leaf temperature slider for exactly this reason. Use it.
Mistake 3: Using the Wrong Zone for the Wrong Stage
A grower sees their reading is in the green zone and relaxes. But green for a seedling is not the same as green for a flowering plant.
Each growth stage has its own ideal VPD range:
- Seedlings need lower VPD (more forgiving air)
- Vegetative plants need moderate VPD
- Flowering plants need higher VPD
If you’re using a generic chart without selecting your crop stage, you could be in completely the wrong zone without knowing it.
Always match the zone to the stage — not just the color.
Mistake 4: Setting It Once and Walking Away
Your grow environment changes constantly — lights heat up the room, humidity rises at night, seasons change outside.
Many growers check VPD once at setup and never check again. But a reading that was perfect at 2pm can be dangerously off at 2am when the lights go off and temperature drops.
VPD needs to be checked regularly — especially when conditions change.
Mistake 5: Confusing Air Humidity With Plant Comfort
High humidity doesn’t automatically mean your plant is happy. Low humidity doesn’t automatically mean your plant is stressed.
A plant at 40% RH and 22°C can be perfectly comfortable. The same plant at 40% RH and 32°C is severely stressed. Humidity alone tells you nothing — only VPD tells you how the plant actually feels.
This is the whole reason VPD charts exist. Stop trusting humidity numbers alone.
Mistake 6: Ignoring the Gray Zone Completely
Most growers focus on avoiding red (too dry) but forget about gray (below dew point). The gray zone is actually the most dangerous — it means water is condensing directly onto your plant’s leaves and buds.
This creates an invisible mold risk that growers often don’t discover until the damage is already done.
If your environment ever touches the gray zone — even briefly overnight — treat it as an emergency.
Want to see a full breakdown of every VPD mistake and how to fix them? Read our guide on Common VPD Mistakes Growers Make — it covers every scenario in detail.
Simple Way to Remember This Process
You’ve learned a lot in this guide. Now let’s make sure it actually sticks.
Here’s one simple formula every grower can remember — no matter their experience level:
🌡️ T → 💧 H → 🍃 L → 🎯 Z → 🔧 A
T.H.L.Z.A.
Temp → Humidity → Leaf → Zone → Adjust
That’s the entire VPD reading process in five letters.
What Each Letter Means:
T — Temperature Check your thermometer first. This is always your starting point. Enter your air temperature into the tool.
H — Humidity Check your hygrometer next. Enter your Relative Humidity percentage. Now two lines are drawn on your chart.
L — Leaf Temperature Check or estimate your leaf temperature. It’s usually 2–3°C below air temperature. This gives you the most accurate VPD reading possible. Don’t skip this.
Z — Zone Look at where your lines cross. What color is it? What zone are you in? Is it right for your current growth stage?
A — Adjust If you’re in the wrong zone — change something. Raise or lower your temperature or humidity until you land where your plant needs to be.
One sentence to remember it all:
“Check the air, check the moisture, check the leaf, find the zone, fix the problem.”
A Real Grower's Daily Habit:
The best growers don’t stress about VPD because they’ve made T.H.L.Z.A. a daily habit — like checking their phone in the morning.
Walk in. Check temp. Check humidity. Check leaf. Glance at the tool. See the zone. Adjust if needed. Walk out.
The whole process takes under two minutes. But those two minutes protect weeks of hard work.
Quick Reminder Card:
Step | What to Do | Tool You Need |
T — Temp | Read your thermometer | Thermometer |
H — Humidity | Read your hygrometer | Hygrometer |
L — Leaf | Estimate or measure leaf temp | IR Thermometer |
Z — Zone | Find your color zone | Our VPD Tool |
A — Adjust | Fix temp or humidity | Your environment controls |
Conclusion
Reading a VPD chart isn’t complicated. It just takes the right tool and a simple process — and now you have both.
Let’s recap what you’ve learned:
- A VPD chart shows whether your air is comfortable or stressful for your plant
- It combines temperature, humidity, and leaf temperature into one clear answer
- Colors tell you exactly where you stand — and what to do next
- The T.H.L.Z.A. process makes it repeatable every single day
The difference between a grower who struggles and a grower who thrives often comes down to one thing — knowing what their plant is actually feeling, not just guessing.
VPD gives you that knowledge. Our tool makes it effortless.
You’re Ready. Now Use It.
Stop guessing your environment. Stop setting humidity to a random number you read somewhere. Stop finding problems only after your plants show them.
Start with your temperature. Add your humidity. Check your leaf temp. Find your zone. Adjust if needed.
Two minutes. Every day. Better grows — every time.
Use Our Free VPD Tool Now — Enter your numbers and find your zone instantly. Works for all crops, all stages, chart and table view included.